


Document Actions
gvSIG Mobile 0.3. User guide
Once the work environment has been created, there are a number of tools that can be used to manage the different layers of information displayed in gvSIG Mobile.
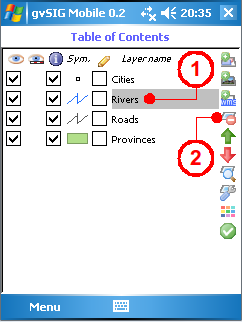
To access them click the Layer Management Tools icon (1) on the main toolbar. This opens the secondary toolbar, which contains a number of layer management tools.
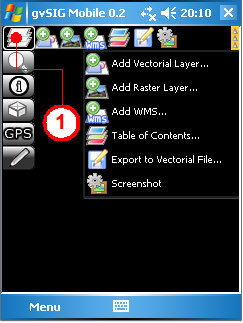
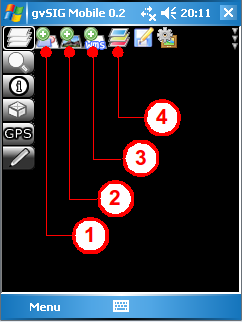
Layer management toolbar
Add layer
New layers can be added directly from the secondary tool bar layer by clicking the Add Vector Layer ... (1), Add Raster Layer ... (2), or Add WMS (3) buttons. It is also possible to add new layers to the project from the Table of Contents window, which can be opened by clicking the Table of Contents... button (4). This window shows all the layers that are currently loaded in the project. This manager has, amongst others, the same buttons for adding layers that can be found on the secondary toolbar mentioned above.
Add new layers to the project
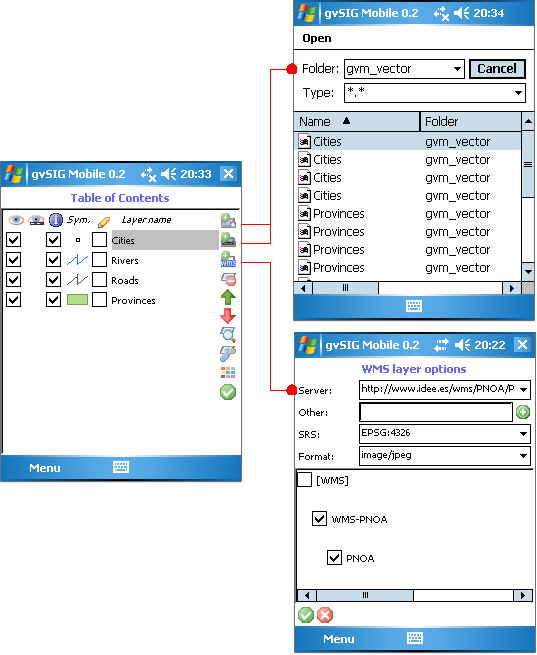
Add layers from the Table of Contents
Add WMS service
Adding a WMS service layer to the project is done via the WMS Layer Options dialog, where a WMS server can be selected from the drop-down list of Servers (1). New services can be added by typing the web address in the Other box (2) and clicking the Add button. When a new service is added in this manner the Capabilities of the service will be requested. The reference system offered by the service can be selected from the SRS list (3) while the format of the image being selected is set in the Format list (4). The bottom window (5) provides a listing of the layers in the service and allows the layers of interest to be selected.
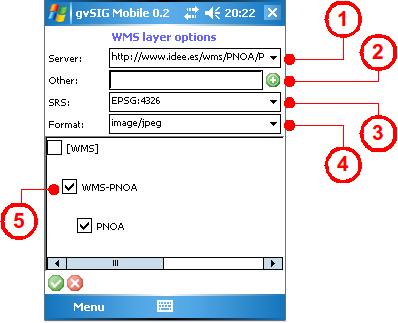
Form for adding a WMS layer
Delete layer
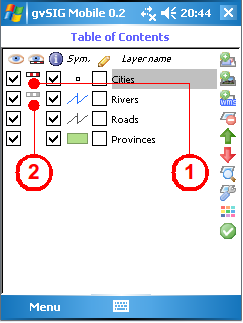
Layers can be removed from the project by accessing the Table of Contents, selecting the layer to be deleted (1), and clicking the Delete Layer button (2).
Delete a layer from the project
Layer properties
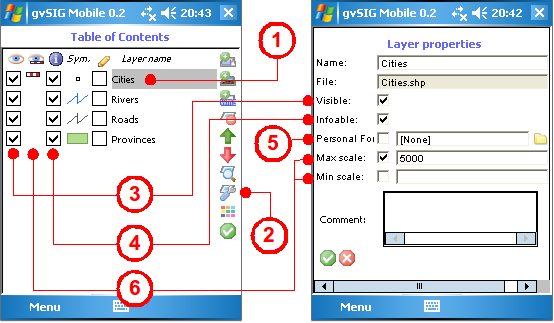
Another feature of the Table of Contents is that the properties of any of the layers in the project can be viewed and configured. First select the layer (1) and then click the Layer Properties button (2) to display the Layer Properties dialog. From here the properties can be viewed and modified.
- Name. Layer name
- File. Path and file name of the layer
- Visible. Indicates whether the layer is visible in the project or not (3)
- Infoable. Indicates whether the attributes associated with the layer can be viewed (4)
- Personal Form. A custom form used to display the attributes of the specific layer (5). Tick the check box and provide the path to the form, which should be defined in an .xml file. Personal forms are described in more detail later on in this manual
- Max scale. Indicates the maximum scale of the layer (6)
- Min scale. Indicates the minimum scale of the layer (6)
- Comment. A space for providing information about the layer
View and modify layer properties
Some of the layer properties, such as their visibility in the view, access to attribute information, or display scales, are shown alongside each layer in the Table of Contents.
Layer visibility
The layers in a project can be switched on or off as needed. This is controlled from the Table of Contents where a check box next to each layer indicates whether it is visible or hidden in the project view. The layer visibility can also be controlled from the Layer Properties form using the Visible check box.
Scale dependent visibility
It is possible to define a visibility range for a layer based on the current scale in the view. The visibility range can be set in the Layer Properties form by entering values for the Max and Min Scales. If visibility ranges have been defined for a layer then this is indicated by the presence of a small icon in the Table of Contents. If the scale bar icon is active (1) then the current scale of the View allows visualisation of the layer, while an inactive icon (2) indicates that the layer is not displayed because the View scale is outside the scale range defined for the layer.
Layer visibility indicated by the scale bar icon
Infoable
Another layer property that can be defined is whether or not their associated attributes are shown. This property can be set either in the Layer Properties form or via the check box in the Table of Contents. When querying layers using the Get Information tool, gvSIG Mobile opens a new window containing the relevant feature attributes if the infoable property of the layer has been enabled.
Display order
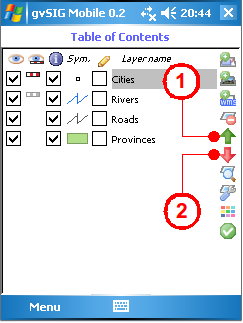
There are two buttons on the side toolbar of the Table of Contents that manipulate the display order of the project layers. The green up arrow (1) moves the selected layer up one place in the display order, while the red down arrow (2) moves the layer down one place in the display order.
Ordering the layers within the project
Simplified layer symbology
This tool is used define the symbology of a project layer. To edit the symbology select a layer in the Table of Contents (1) and press the Layer Symbology button (2). The Layer Symbology form (shown below) allows the symbology attributes of a vector layer to be edited:
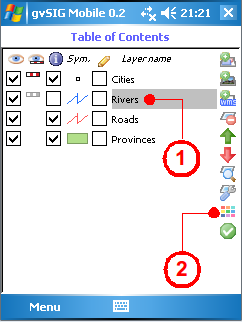
Accessing the Layer Symbology form
- Point layers (3)
- Size. Size of the points
- Colour. Colour of the points
- Line and polyline layers (4)
- Line width. Width of the lines
- Colour. Colour of the lines
- Polygon layers (multi-layer geometries) (5)
- Line width. Width of the polygon border
- Border colour. Colour of the polygon border
- Filled. Indicates whether the polygon is filled
- Fill Colour. Fill colour of the polygon
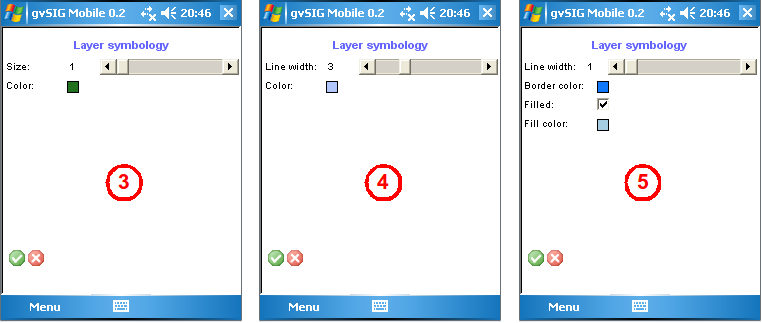
Symbology for points, lines and polygons
Exporting vector layers
With the Export to Vector File utility (1) any vector layer loaded in the Table of Contents can be selected (2) and exported to another supported vector format by either creating a new file or by overwriting an existing one. The available vector formats are GML (Geographic Markup Language) in two different versions (2.x and 3.2), KML (Keyhole Markup Language) and SHP (Shapefile) (3).
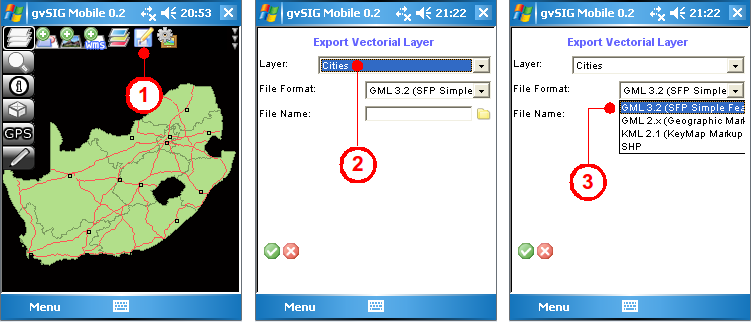
Exporting a vector layer
Capture a screenshot
This utility captures a screenshot of the map displayed in the View on the device (1).
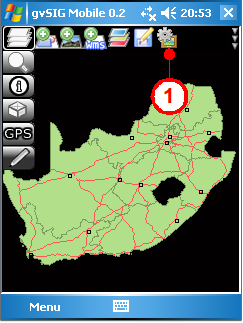
Capturing a screenshot of the View


